Slow applications can frustrate users, leading to bad reviews, or customers swiping to the left to compete. Unfortunately, viewing and solving performance problems can be a arduous and time-consuming task.
Most developers use profilers in IDEs such as Android Studio or Xcode to find bottlenecks and automate performance testing to capture performance regressions in the code during development. However, it is not enough to test the application before it is released.
To discover the most frustrating performance issues, you need to explore what is happening on the user’s device. This means knowing the speed of your application startup, the duration of the HTTP request, the number of slow and freeze frames, the speed of your view loading, and so on. With Sentry for Mobile, you can now easily monitor the performance of iOS and Android applications in real time without the need for additional setup (or accumulating a bunch of test equipment)
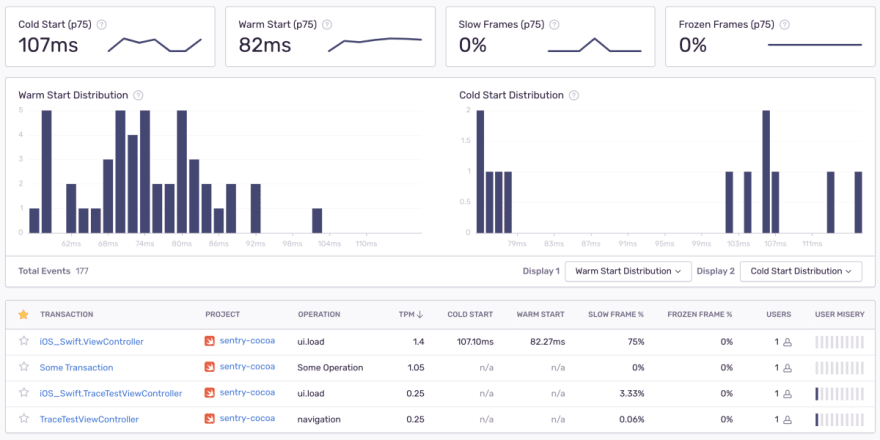
1. Mobile Vitals
We believe that every mobile team should track four metrics to better understand the performance of their application: cold start, hot start, slow frame and freeze frame. As the core part of Sentry performance monitoring, these four indicators provide you with the detailed information you need. Not only can you determine the priority of key performance issues, but you can also trace the issues back to the root cause to resolve them faster
2. Start the measurement application
When the user clicks on your app icon, it should launch quickly. On iOS, Apple recommends that your app requires up to 400 milliseconds to render the first frame. On Android, the Google Play console will warn you when the cold start time exceeds 5 seconds or the hot start time exceeds 2 seconds
- Cold start: The application starts for the first time after restarting or updating.
- Hot start: The application is started at least once and part of it is in memory.
Regardless of the platform, it is vital that your application launches quickly to provide a pleasing user experience. This is why on iOS, Mac Catalyst, tvOS, and Android, we track the time it takes your app to draw the first frame. We obtain this information and add a span for the different stages of application startup. Here is an example from iOS:
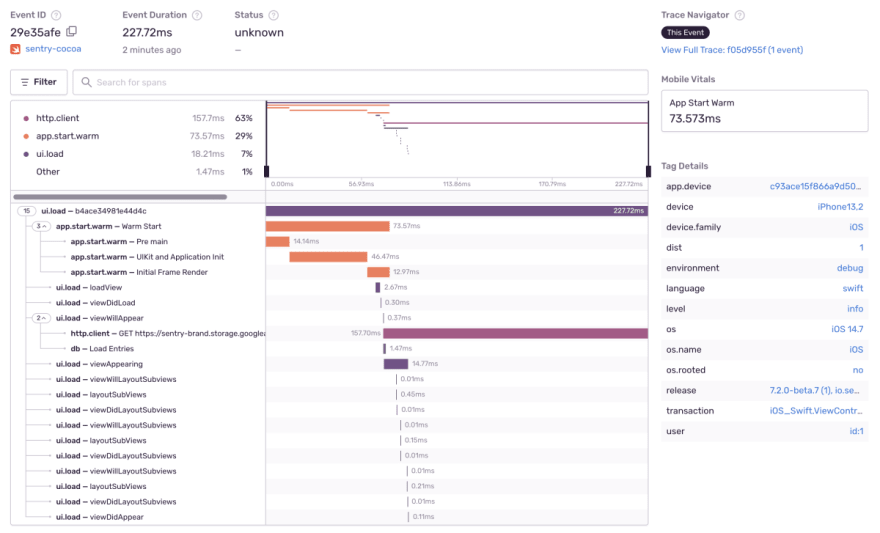
On Android, hooking to the initialization phase of application startup is tricky, so we are currently adding a span from application startup to the first automatically generated UI transaction. However, this information is very useful and can help you extend the duration of your app’s launch
3. Slow and Frozen Frames
Unresponsive UI, animation glitches, or just freezing can annoy users and reduce user experience. The two measurements to track this unwanted experience are slow frames and freeze frames. Mobile phones or tablets usually render at 60 frames per second (fps).
Frame rates can also be higher, especially as 120 fps monitors become more popular. For 60 fps, there is 16.67 milliseconds of rendering time per frame. If your application requires frames longer than 16.67 milliseconds, it is a slow frame.
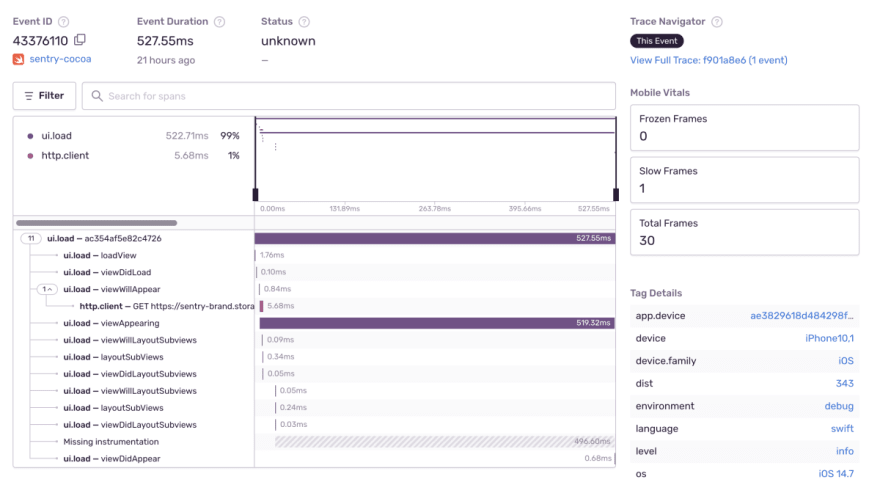
Freeze frames are UI frames that take more than 700 milliseconds. Applications that run smoothly should not be experienced either. This is why the SDK adds these two metrics to all transactions captured. The detailed view of the transaction shows slow frames, freeze frames and total frames on the right
4. Mobile performance monitoring
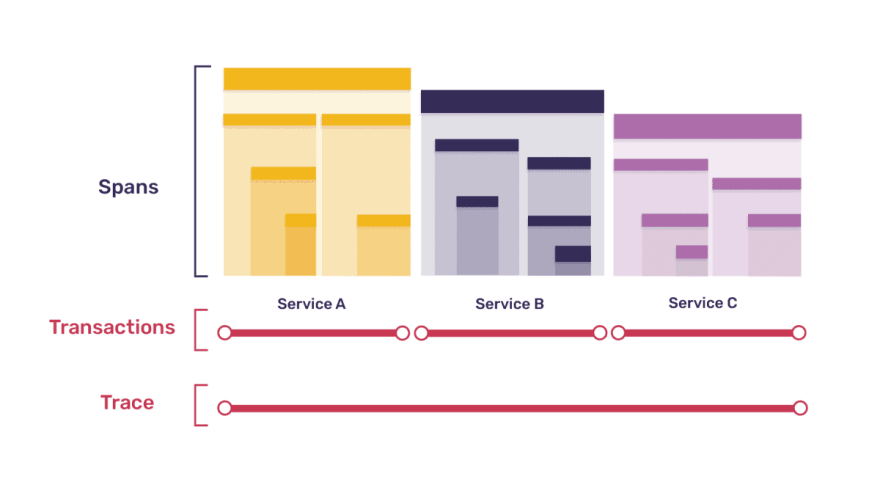
The goal is to track the performance of your application across multiple services. To measure mobile vital signs, the SDK captures distributed traces composed of transactions and spans.
Distributed tracing is a standard technique for understanding what is happening in distributed services, but it is still relatively new for mobile applications. Tracking represents actions you want to measure, such as logging in or loading a view in your app. The above two operations involve not only your application, but also back-end operations. Each trace consists of one or more transactions, and these transactions can contain one or more spans. For example, the login trace may include one transaction for your application and two transactions for your back-end service.
Each transaction contains multiple spans that represent a single unit of work, such as reading a file or querying a database. A span has a parent-child relationship, which means that a span can have multiple children and grandchildren. This is an example trace, broken down into transactions and spans:
Post comment 取消回复